Navigating the Raw Materials Storm: A Comprehensive Analysis of Commodity Price Dynamics in the Passive Electronic Component Industry
12/04/2025 //
The passive electronic component industry's fortunes are inextricably linked to the commodities markets. Over the past thirteen years, manufacturers have weathered extraordinary volatility across base metals, precious metals and energy inputs.
The Paumanok Monthly Price Index for Electronic Raw Materials reveals a story of unprecedented disruption, from the commodity super-cycle collapse of 2014-2016 to the COVID-induced chaos of 2020-2021, culminating in the geopolitical shocks that have reshaped markets in 2022-2025. The November 2025 price index for raw materials consumed in passive electronic components is now at $3,399, which is 8% higher than the April 2012 level; but much tamer than the volatility the index has shown over the past ten years.
Our analysis of nine critical raw materials – nickel, copper, aluminum, zinc, palladium, ruthenium, tantalite, silver and oil – consumed as dielectric, electrode and termination materials in capacitors, resistors and inductors, provides essential intelligence for understanding margin pressures and strategic sourcing decisions facing the industry today.
The manufacturing of mass-produced surface mount capacitors, resistors and inductors relies heavily on specialized engineered powders and pastes, primarily composed of advanced ceramics and refined metals. In passive electronic components, raw materials represent the largest variable cost in the production process, directly influencing pricing and profitability.
For this November update on raw materials, silver and ruthenium are key metals to watch for future volatility.
COMPOSITE ANALYSIS: THE TOTAL PRICE INDEX
The aggregate price index – sum of all nine commodities – tells the complete story. Beginning at $3,139 (April 2012), the index collapsed to $1,679 (January 2016) during the commodity super-cycle collapse – a devastating 46% decline that benefited component manufacturers but decimated mining companies. Recovery was gradual through 2019, reaching only $2,560 (April 2019). COVID created chaos, starting at $2,933 (August 2020) then exploding to $5,811 (April 2022) – a stunning 166% surge in 20 months representing the most extreme raw materials inflation in index history. By August 2023, the index retreated to $3,568, still well above the 2020 lows and 2012 starting levels. The November 2025 price index for raw materials consumed in passive electronic components is now at $3,399 USD, which is 8% higher than the April 2012 level.
The chart below shows the long-term cost trends associated with producing passive electronic components.
Figure 1. Passive Component Raw Material Index: Pricing Trend 2012-2025
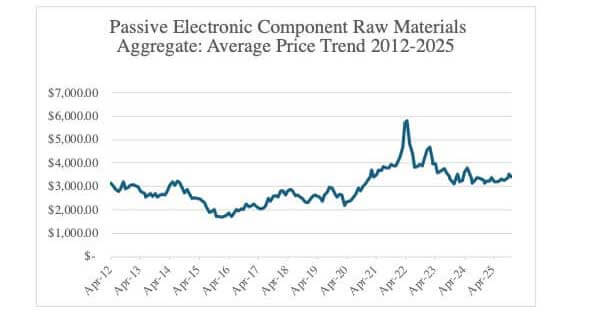
Source: Paumanok IMR ©2025. The above chart illustrates aggregate pricing for key feedstocks consumed as the primary dielectric material, resistive element, electrode or termination material for the production of trillions of passive electronic components.
NICKEL (U.S. Dollars per Ton)
Nickel is the primary electrode material consumed in high capacitance multilayered ceramic chip capacitors (MLCCs). The fluctuations in nickel price are primarily the result of competition for the metal with the steel industry, where it is used as a hardener. Nickel supply is in turn important for the production of X5R, Y5V and X7R MLCCs, which are the capacitors of choice for the operation of smartphones, tablets and TV sets. The market has shown extreme volatility from 2021 through 2025 due to supply chain choke points, hyper-inflation and competition for keystone metals consumed in multiple industries seeking to reduce carbon emissions.
Historical Trajectory
Nickel began our tracking period in April 2012 at $16,071/ton, reflecting robust demand from stainless steel and battery applications. The commodity entered a sustained bear market from 2013-2016, bottoming at $7,540/ton in February 2016 – a stunning 53% decline that devastated nickel miners and forced widespread production cutbacks.
Recovery was gradual through 2016-2019, with prices stabilizing in the $10,000-15,000 range as Indonesian supply disruptions and growing EV battery demand provided support. The COVID crisis initially pressured prices to $10,080/ton (August 2020), but the subsequent green energy boom drove a powerful rally.
The 2022 Crisis
March 2022 witnessed one of the most dramatic commodity dislocations in modern history. Russia's invasion of Ukraine triggered panic buying, with nickel exploding to $31,325/ton – nearly quadruple its 2020 lows. The London Metal Exchange was forced to suspend trading as short squeezes threatened the entire market structure. Prices subsequently normalized to $23,000-26,000/ton through mid-2022 before settling back to $23,159/ton by June 2022.
2025 Levels
The nickel price trended downward in 2025 from annual highs of $14,459 per ton in March 2025 to $13,060 per ton in November 2025.
Figure 2. Nickel Price Trend: 2012-2025
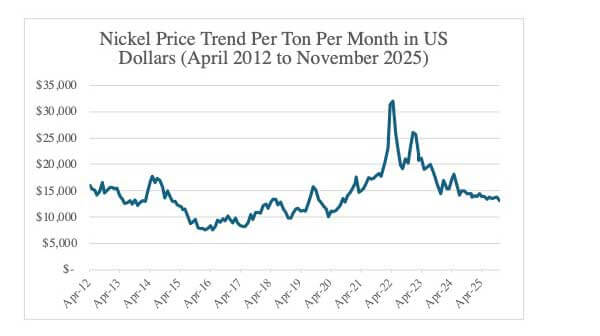
Source: ©2025 Paumanok IMR. In U.S. Dollars Per Ton. The chart above illustrates the price trend for nickel ore, which is a keystone material consumed in the MLCC electrode and a key material for thin film and precision resistive layers.
Outlook
Nickel faces a bifurcated future. Class I nickel for battery applications commands premium pricing as EV adoption accelerates, while Class II nickel for stainless steel remains under pressure from Indonesian laterite operations. For MLCC capacitor manufacturers using nickel as internal electrodes, expect continued volatility with a floor around $10,000-15,000/ton and potential spikes to $20,000+ during supply disruptions.
COPPER (U.S. Dollars per Ton)
Copper-engineered powders are consumed in the production of MLCCs as well but as the termination material consumed in conjunction with the nickel type electrode. Therefore, copper and nickel are an important type of base metal duo. Copper is used in some MLCC electrode systems because, unlike its counterpart nickel, it is non-magnetic. The price of this metal, which is key for energy storage solutions, has shown extreme volatility from 2021 through 2025 due to supply chain disruptions.
Historical Trajectory
Copper started at $7,531/ton in April 2012 before declining through China's economic slowdown to bottom at $4,023/ton in January 2016 – a 47% collapse that reflected oversupply and weakening industrial demand. The metal traded sideways through 2016-2019 in the $4,500-6,500 range as mining discipline improved.
COVID-19 initially crashed copper to $4,014/ton (June 2020), but unprecedented fiscal stimulus and infrastructure spending globally ignited a powerful recovery. By May 2021, copper reached $8,980/ton, driven by electrification trends and constrained mine supply.
Recent Performance
Copper has maintained elevated levels through 2022-2025, ranging $8,000-10,000/ton – well above historical averages. The metal closed our dataset at $9,700/ton (November 2025), reflecting tight concentrates markets, energy constraints on smelting capacity and surging demand from renewable energy infrastructure.
Figure 3: Copper Price Trend – 2012-2025
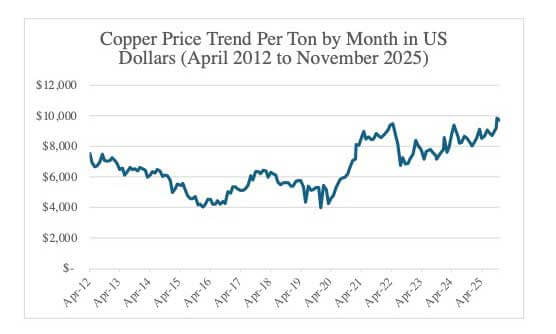
Source: ©2025 Paumanok IMR. In U.S. Dollars Per Ton. The chart above illustrates the price trend for copper ore, which is a keystone material consumed in the MLCC termination matched with nickel electrode and a key specialty electrode material for non-magnetic MLCCs.
Outlook
Copper is the "metal of electrification," and its outlook remains constructive. Declining ore grades, permitting challenges for new mines and exponential demand growth from EVs, solar/wind installations and data centers suggest structural deficits emerging by 2025-2027. For passive component manufacturers – particularly MLCC producers using copper internal electrodes and thick-film resistor manufacturers – input costs will remain elevated. Expect copper to trade $8,000-11,000/ton over the next 24 months, with potential for $12,000+ if China's economy stabilizes.
ALUMINUM (U.S. Dollars per Ton)
Etched anode and cathode aluminum foils are consumed as the dielectric layers of aluminum electrolytic capacitors. Aluminum comes from bauxite, which is a mined material. Aluminum is abundant in the Earth’s crust and its price has been historically stable. Aluminum electrolytic capacitors are important components consumed in power supplies, television sets, computers and power electronics, including renewable energy systems. The market has shown extreme volatility between 2021 and 2025 due to supply chain problems and speculation due to its substantial shift in sourcing of aluminum ores and concentrates.
Historical Trajectory
Aluminum began at $1,834/ton (April 2012) and experienced remarkable stability compared to other metals, trading primarily in the $1,300-2,000 range through 2020. Chinese overcapacity kept global prices suppressed despite periodic supply discipline efforts.
The metal bottomed at $1,305/ton (November 2015) during the commodity rout then recovered modestly to $1,500-2,000/ton through 2019.
Energy Crisis Impact
Aluminum's fortunes changed dramatically in 2021-2022. As an extremely energy-intensive metal requiring 15,000 kWh per ton, soaring electricity and natural gas prices drove production costs skyward. European smelters shut down en masse. Aluminum spiked from $1,969/ton (October 2020) to $3,500/ton (May 2022) – a 78% surge in 19 months.
Recent Performance
Our data shows aluminum at $2,498/ton (November 2025) and trending upward after another volatile year between April and November. The metal has been whipsawed by China's power curtailments, Russian supply sanctions and global energy volatility.
Figure 4: Aluminum Price Trend – 2012-2025
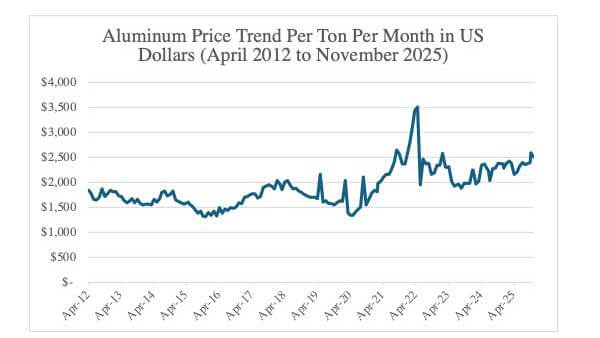
Source: ©2025 Paumanok IMR. In U.S. dollars per ton. The chart above shows the price for aluminum ore feedstock, which is a keystone material for aluminum electrolytic capacitor anode and cathode foils as well as a key raw material for resistor substrates.
Outlook
Aluminum's trajectory hinges on energy markets and Chinese production discipline. For aluminum electrolytic capacitor manufacturers and resistor producers using aluminum housing, the $2,200-2,800/ton range appears sustainable near-term. However, structural underinvestment in smelting capacity and decarbonization pressures (green aluminum commands significant premiums) suggest limited downside. European energy costs remain prohibitive for domestic production, creating supply chain vulnerabilities. Diversification away from European suppliers is prudent.
ZINC (U.S. Dollars per Ton)
Zinc is used as an additive in ceramic chip capacitors and as the primary ingredient in the production of metal oxide varistors, which are consumed for circuit protection components in all known AC-line voltage equipment and to protect digital electronics from the effects of electrostatic discharge. The zinc price has been more recently unstable as is shown in the chart below.
Historical Trajectory
Zinc tracked at $1,812/ton (April 2012) before declining to $1,378/ton (January 2016) – a 24% drop during the commodity downturn. The metal then enjoyed a strong 2016-2018 rally, surging to $3,705/ton (April 2022) driven by mine closures, smelter shutdowns and treatment charge disputes between miners and refiners.
Supply Constraints
Zinc has been plagued by structural supply issues. Major mine closures (Century, Lisheen) coincided with falling ore grades and new project delays. Chinese environmental crackdowns on smelters exacerbated shortages. These dynamics drove prices to multi-year highs of $3,800/ton (May 2022).
Recent Trends
By November 2025, zinc had retreated to $2,834/ton as recession fears tempered demand expectations, particularly from construction and automotive sectors – zinc's primary end markets through galvanizing applications. Zinc has increased steadily in price since dropping sharply in April 2025.
Figure 5: Zinc Price Trend – 2012-2025
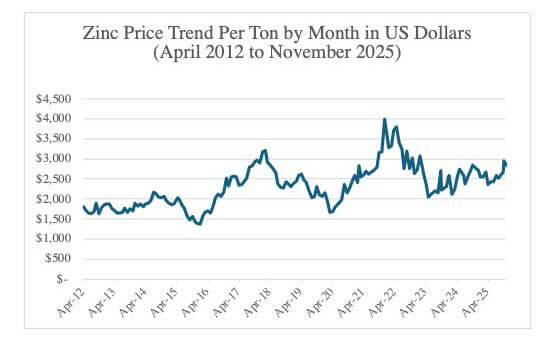
Source: ©2025 Paumanok IMR. In U.S. dollars per ton. Zinc is a primary material consumed in non-linear resistor as the active ingredient in zinc-oxide varistors.
Outlook
For varistor manufacturers using zinc oxide and zinc-based termination materials, the outlook is mixed. Mine supply is improving as higher prices incentivized development, but smelting capacity remains tight due to high energy costs in Europe. Expect zinc to trade $2,200-3,000/ton over the next 12-18 months. Chinese economic stimulus measures could drive spikes to $3,000/ton, while a global recession could push prices toward $2,000/ton. The key variable is construction activity in China and India.
PALLADIUM (U.S. Dollars per Troy Ounce)
Palladium is a platinum group metal that is mined in South Africa and Siberia, among other locations. It is consumed primarily for auto-catalysts but also for jewelry and as the primary electrode material is precious metal based MLCCs, which are in turn used in high reliability, high temperature and high voltage printed circuit boards globally. Historically, palladium has proven a difficult raw material partner for the MLCC supply chain because of its price volatility, a by-product of it being a “speculative” metal subject to trading as a financial instrument.
Historical Trajectory
Palladium entered our dataset at $653/oz (April 2012) and experienced wild volatility over thirteen years. The metal crashed to $488/oz (January 2016) during the diesel emissions scandal and commodity bear market.
Automotive Demand Surge
Palladium's fortunes transformed 2016-2021 as gasoline engine emissions standards tightened globally and diesel's decline shifted catalyst demand toward palladium-rich formulations. The metal exploded from $488/oz (January 2016) to $2,842/oz (February 2021) – a staggering 482% gain in five years.
Russia Shock and Correction
The Russia-Ukraine conflict created havoc in palladium markets, as Russia supplies 40% of global mine production. Prices spiked to $2,650/oz (May 2022) but have since corrected to $1,785/oz (June 2022) as recession fears and falling auto production tempered demand. By April 2025, palladium price dropped to $938 per troy ounce and has since increased to $1,397 per troy ounce in November 2025.
Figure 6: Palladium Price Trend by Month – 2012 to 2025
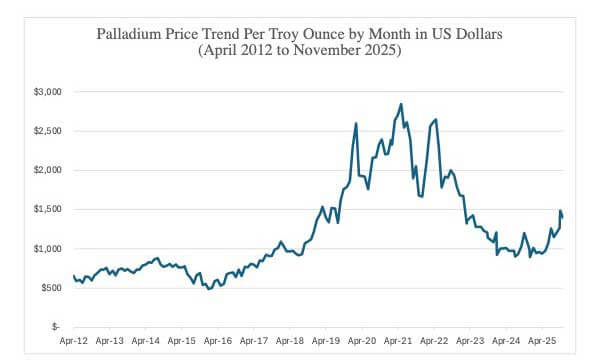
Source: ©2025 Paumanok IMR. In U.S. dollars per troy ounce.
Palladium is a metal that is used in MLCC electrodes for mission critical applications in high voltage, high temperature and high frequency. Such high feedstock pricing impacts costs to produce for many small MLCC manufacturers and this is the primary motivating factor behind the movement to alternative electrodes and alternative MLCC designs in many end-markets where it has not been used before such as fossil fuel engine electronics, defense, space and oil and gas electronics.
Outlook
For MLCC manufacturers using palladium-silver alloys as precious metal electrodes (PME), the current correction offers relative relief after years of cost pressure. However, palladium remains vulnerable to geopolitical supply disruptions. The metal's outlook is bearish medium-term as: (1) EV adoption reduces catalyst demand, (2) platinum-for-palladium substitution accelerates at current price ratios and (3) hybrid vehicle penetration (which use more platinum) increases. Expect palladium to trade $1,500-2,200/oz through 2026, with downside to $1,200/oz if recession materializes. This creates opportunities for PME MLCC cost reduction, though Russia supply risks remain elevated. Thrifting and substitution efforts should continue.
RUTHENIUM (U.S. Dollars per Troy Ounce)
Ruthenium is a precious metal that is similar to that of palladium, but its primary purpose is to be consumed in all thick film chip resistors and resistor networks produced worldwide. The price of ruthenium has shown extreme volatility because of its association with palladium mining activities in South Africa. The reader should remember that reliance on ruthenium for all mass-produced thick film chips is a weakness that threatens the entire high-tech economy. The ruthenium price skyrocketed in March, signaling increased demand from the resistor chip and network supply chain amidst slowdowns in overall PGM mining due to electric vehicles impacting traditional fossil fuel production.
Historical Trajectory
Ruthenium is the most obscure yet fascinating metal in our dataset. Beginning at $115/oz (April 2012), it collapsed to just $40/oz by late 2015 – a 65% decline reflecting oversupply from South African and Russian sources.
The metal traded in a tight $40-70/oz range through 2017, with minimal price discovery due to thin markets and limited trading.
Dramatic Surge
Ruthenium exploded beginning in late 2017, surging from $67/oz (June 2017) to $850/oz (April 2022) – a mind-boggling 1,169% increase. This unprecedented rally reflected: (1) Russian export restrictions, (2) severe South African mining disruptions, (3) growing industrial demand in resistor applications and (4) extreme market illiquidity allowing small demand shifts to drive massive price moves.
Current Status
Ruthenium has been volatile and concerning, increasing back to $915/oz (November 2025), growing from $615 in April 2025.
Figure 7: Ruthenium Price Trend – 2012-2025
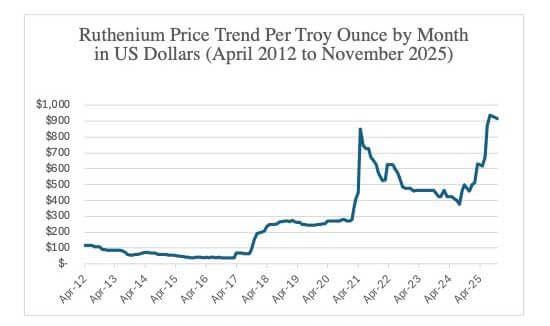
Source: ©2025 Paumanok IMR. In U.S. dollars per troy ounce.
This price volatility has caused customers to seek alternative resistor designs also based upon thin film nickel. Unfortunately, the economies of scale in manufacturing for thin film resistors are but a small fraction of that of thick film chips, one of the largest volume products produced in the world (measured in the trillions of pieces). Resistors represent a significant volume of worldwide consumption for ruthenium metal (with additional uses as a cracking catalyst, a hard disc drive coating and as an esoteric chemical compound). Therefore, the metal is very sensitive to any changes in resistor supply and demand the global high-tech economy and its signpost on the current market conditions should not be overlooked by the precious metal market analyst.
Outlook
For thick-film resistor manufacturers using ruthenium-based inks and chip resistor producers, this metal represents the most serious cost challenge in decades. Ruthenium's outlook depends heavily on Russian supply, which remains constrained by sanctions. South African production faces ongoing power shortages (Eskom load-shedding) and labor issues. With no substitutes offering comparable performance in precision resistor applications, manufacturers face difficult choices: (1) accept elevated costs, (2) reformulate inks with lower ruthenium loading or (3) pass costs to customers. Expect ruthenium to remain elevated at $600-1100/oz through 2026. Any further Russian supply disruption could drive prices back above $1,100/oz. This commodity deserves intense supply chain scrutiny and strategic inventory positioning.
TANTALITE (U.S. Dollars per Pound)
The majority of tantalite metal used in the production of tantalum capacitors comes from Central Africa. Other known tantalite resources are located in Australia, Brazil and Canada. Tantalite’s primary use is as capacitor grade tantalum metal powder for consumption in capacitor anodes. Tantalum capacitors are consumed in communications networking equipment, smartphones, automotive, medical and defense electronics. Tantalite and tantalum ores have demonstrated volatile pricing in the past but has remained relatively stable in price during the current market shortages. The reader should know that the lessons learned from the tantalum supply chain have been and will continue to be valuable as OEM brands insist on transparency on all material supply chains. Tantalum pricing has been stable in comparison to other dielectric materials for an extended period of time.
Historical Trajectory
Tantalite (tantalum concentrate) began our period at $100/lb. (April 2012), surged briefly to $145/lb. (October-December 2012), then entered a prolonged decline to $52/lb. (February 2016) – a 64% collapse reflecting oversupply from African sources and reduced defense/aerospace demand.
The ore traded in a relatively stable $55-100/lb. range through 2018, with occasional spikes driven by conflict minerals certification issues and temporary supply disruptions in the Democratic Republic of Congo (DRC) – source of 60%+ of global tantalum supply.
Recent Trends
Tantalite experienced renewed volatility 2020-2022, rising from $50/lb. (November 2020) to $105/lb. (August 2021) as smartphone and automotive production surged post-COVID. By June 2022, the ore had retreated to $90/lb., and by November 2025 it is at $83 USD per pound.
Figure 8: Tantalum Ore Price Trend: 2012-2025
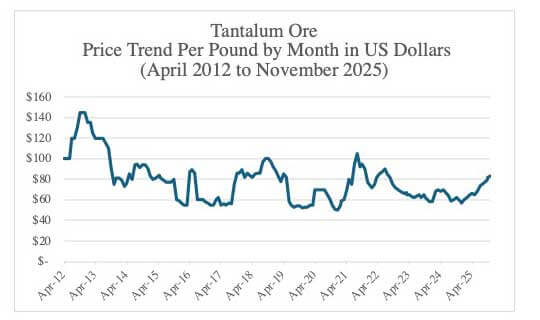
Source: ©2025 Paumanok IMR. In U.S. dollars per pound. Paumanok Publications estimates that the primary raw materials consumed in the production of tantalum capacitors are capacitor grade tantalum metal powder and wire, which is engineered from high purity tantalum ores and concentrates. Tantalum, a rare metal, represents a significant portion of the variable costs to produce for tantalum type capacitors.
Outlook
For tantalum capacitor manufacturers, the outlook is relatively stable compared to other commodities. African mine supply (DRC, Rwanda, Ethiopia) continues expanding, while recycling initiatives improve secondary supply. Chinese processing capacity dominates, creating geopolitical concentration risk. Expect tantalite to trade $75-110/lb. over the next 24 months. Downside risks include smartphone market saturation and tantalum-to-MLCC substitution in some applications. Upside risks include conflict minerals supply disruptions and aerospace/defense demand recovery. The key monitoring point is Chinese export policies – any restrictions on processed tantalum powder/wire would spike prices dramatically. Diversification of supply chains away from Chinese processing should be a strategic priority for tantalum capacitor producers.
SILVER (U.S. Dollars per Troy Ounce)
Silver is consumed as a termination material for many electronic components but primarily for MLCCs that employ precious metal electrodes. MLCCs with precious metal electrodes and silver terminations are in turn consumed in high voltage, high temperature and high reliability MLCCs for similar end-use market segments. The reader should note that the two primary termination metals for MLCC – copper and silver – are under price pressure.
Historical Trajectory
Silver entered our dataset at $30.30/oz (April 2012) during the tail end of the post-2008 precious metals bull market. The metal collapsed to $14.20/oz (November 2015) – a 53% decline – as quantitative easing ended and real interest rates rose.
Silver traded sideways $14-19/oz through 2019, serving its dual role as monetary metal and industrial commodity. In November 2025, the metal hit $50 per ounce, an index high.
COVID and Reddit Rally
The pandemic drove extreme volatility. Silver initially crashed to $15.40/oz (March 2020) then exploded to $28.10/oz (August 2020 and August 2021) fueled by: (1) monetary debasement fears, (2) solar panel demand surge, (3) Reddit/WallStreetBets short squeeze attempts and (4) inflation hedging. In November 2025, silver hit a new index high of $50 per troy ounce.
Figure 9: Silver Ore Price Trend – 2012-2025
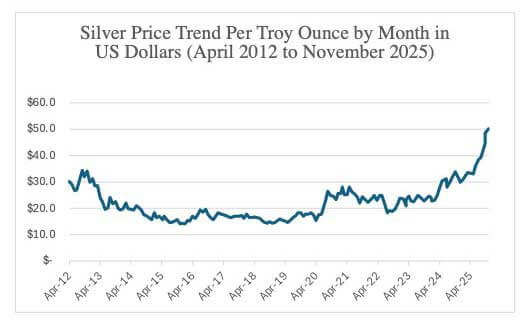
Source: ©2025 Paumanok IMR. In U.S. dollars per troy ounce.
Outlook
For MLCC manufacturers using silver-palladium PME MLCCs and thick-film paste producers, silver's outlook is constructive but range-bound. The metal faces competing forces: bearish from rising real interest rates and potential recession and bullish from solar demand growth, industrial applications and monetary debasement concerns. The silver-to-gold ratio currently suggests silver is undervalued relative to gold, supporting gradual appreciation. For component manufacturers, silver represents less risk than palladium or ruthenium given more liquid markets and diverse supply sources. However. It has risen steadily throughout 2025 and is concerning because of its use in large volumes of low layer count MLCC.
STRATEGIC IMPLICATIONS FOR THE PASSIVE COMPONENT INDUSTRY
Near-Term Outlook (2023-2024)
The raw materials super-spike of 2021-2022 is moderating but not reversing. Recession risks could drive 15-25% corrections across most commodities, but structural supply constraints, geopolitical fragmentation and underinvestment in mining/energy infrastructure prevent a return to 2015-2019 price levels.
Key Strategic Recommendations
- Diversify Supply Chains: Russian (nickel, palladium and ruthenium), Chinese (rare earths, tantalum processing and aluminum) and African (tantalum, cobalt) concentration risks demand urgent mitigation. Multi-source strategies are no longer optional.
- Accelerate Substitution: BME MLCC technology (copper replacing palladium-silver) offers substantial cost advantages at current price ratios. Resistor manufacturers must continue ruthenium thrifting and alternative ink formulations.
- Long-Term Agreements: For critical materials (nickel, copper and ruthenium), multi-year supply agreements with price caps can hedge against volatility. Current prices, while elevated, may prove attractive relative to 2024-2025 spot markets.
- Pass-Through Mechanisms: Customer contracts must include robust raw material surcharge mechanisms. The era of stable commodity pricing is over; price volatility must be shared across the supply chain.
- Regional Production Strategy: Energy-intensive operations (ceramic firing and sintering) should shift toward low-cost energy regions. Transportation-intensive operations should regionalize near end-customers to minimize logistics exposure.
- Strategic Inventory: For metals with illiquid markets (ruthenium and tantalum), strategic inventory positioning at price troughs can provide competitive advantage. However, working capital implications must be carefully managed.
CONCLUSION
The passive electronic component industry faces a fundamentally altered raw materials landscape. The benign commodity environment of 2015-2019 – when manufacturers enjoyed stable and low input costs – is gone. Geopolitical fragmentation, energy transition dynamics, underinvestment in commodity production and inflation have created a regime of elevated prices and persistent volatility.
Manufacturers who adapt through substitution, supply chain diversification and strategic risk management will thrive. Those who assume commodity normalization will struggle with margin compression and supply disruptions. The data is clear: the age of cheap commodities is over. The industry must adapt accordingly.
Paumanok Publications, Inc. is the world's largest supplier of market research and consulting services to the passive electronic component industry. For 38 years, Paumanok has supplied research products and services for trade companies and private equity firms that have a financial interest in or are directly involved in the supply chain for capacitors, resistors, inductors and circuit protection components as well as the engineered materials and ores associated with their key functions.
Follow TTI, Inc. on LinkedIn for more news and market insights.
Statements of fact and opinions expressed in posts by contributors are the responsibility of the authors alone and do not imply an opinion of the officers or the representatives of TTI, Inc. or the TTI Family of Specialists.
Follow TTI, Inc. - Europe on LinkedIn for more news and market insights.
Statements of fact and opinions expressed in posts by contributors are the responsibility of the authors alone and do not imply an opinion of the officers or the representatives of TTI, Inc. or the TTI Family of Specialists.
Dennis M. Zogbi

Dennis M. Zogbi is the author of more than 260 market research reports on the worldwide electronic components industry. Specializing in capacitors, resistors, inductors and circuit protection component markets, technologies and opportunities; electronic materials including tantalum, ceramics, aluminum, plastics; palladium, ruthenium, nickel, copper, barium, titanium, activated carbon, and conductive polymers. Zogbi produces off-the-shelf market research reports through his wholly owned company, Paumanok Publications, Inc, as well as single client consulting, on-site presentations, due diligence for mergers and acquisitions, and he is the majority owner of Passive Component Industry Magazine LLC.