Costs to Produce Electronic Components: An Active and Passive Component Comparison for 2025
02/14/2025 //

Overview
In the worldwide electronic component industry, gross profitability varies from 30% to 45% (see Table 1.0) based upon whether or not the component is passive or active in design, while costs to produce electronic components range from 55% to 70% of revenues. Both ecosystems are subject to the same financial measurements based upon fixed and variable cost structures. This article explores the ingredients that go into cost of sales for each supply chain and attempts to explain the distance between the two in value and volume of consumption and the direction of the industry as it continues its quest for better, smaller and faster.
Table 1.0
Estimated Gross Profit Margins: Active Versus Passive Electronic Components - 2025 Paumanok Perspective

Source: Paumanok Publications, Inc.
For this article, average gross profit margins are derived from an analysis of the financial reporting of the top 10 semiconductor manufacturers and the top 13 passive component manufacturers. In 2025, certain vendors in GPU and multilayered ceramic chip capacitors (MLCCs) have higher profitability than their contemporaries which has skewed the data reporting upward for the fiscal year ending March 31, 2025, and is forecasted based upon nine months of reporting. Also, based upon primary studies on profitability and component EBITDA conducted in 2005 and 2013, we note that the profitability has also been impacted by post-pandemic hyper-inflation.
Active Versus Passive Components
The gross profit margins of the semiconductor industry are larger than that of its support components because of the unique requirements related to research and development and subsequent capital equipment costs with keen emphasis upon advanced lithography equipment. The equipment manufacturers have gross profit margins that average 53% and are therefore the highest in the industry.
The Semiconductor Component Ecosystem
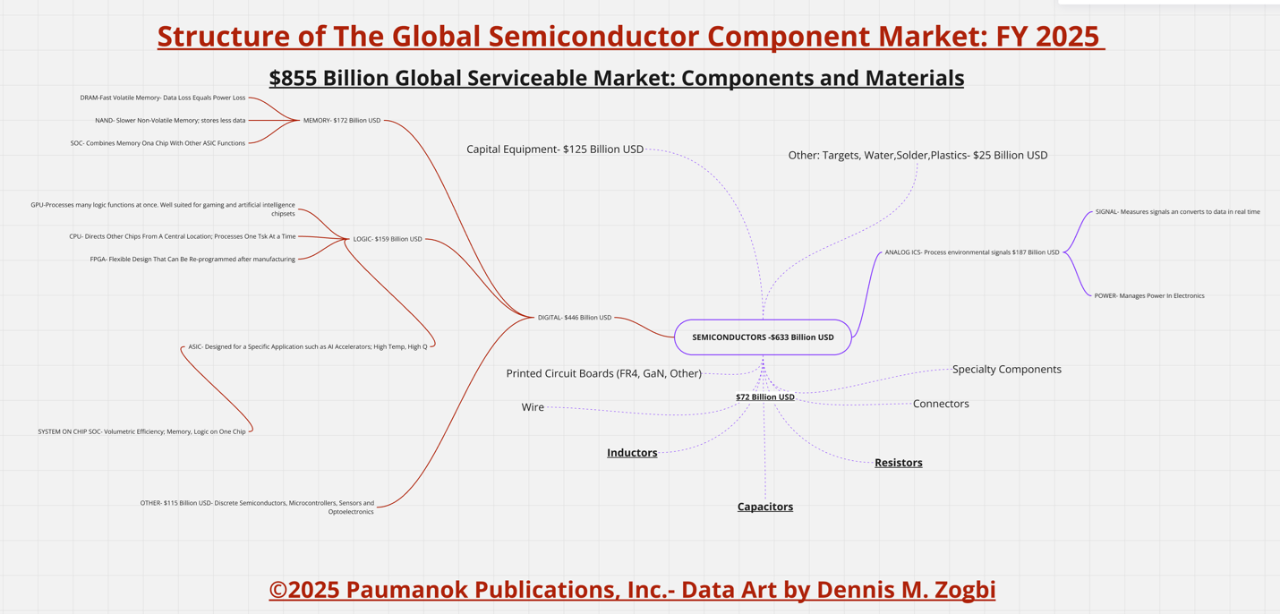
We estimate the global active component semiconductor industry to be $633 billion for 2025 (see Figure 2.0). The average rate of gross profitability is 45% ($285 billion). However, as we have noted; the semiconductor industry is reliant upon third party equipment vendors for technology advancement; which results in massive R&D spending on unique capital equipment costs ($125 billion for 2025).
Semiconductors: Mapping Out the Complex Ecosystem
An active component is a semiconductor device that falls into two primary ecosystems – digital and analog – with digital semiconductors including memory and logic and analog semiconductors including both signal and power.
Semiconductors for digital memory include DRAM (volatile memory) and NAND (non-volatile memory); while semiconductors for digital logic include the GPU, CPU, FPGA and the ASIC.
The GPU processes many tasks at once and is ideal for graphics cards and for artificial intelligence chipsets (this is where global financial optics have been focused in 2025). Meanwhile, the CPU is a semiconductor that processes only one task at a time and, as a central hub, gives directions to other chip sets.
The FPGA is an entirely separate logic semiconductor business because the components can be reprogrammed after manufacturing (a flexible, double-edged sword) while the ASIC is designed for one specific purpose that tis into passive support components based upon high temperature, high frequency or high voltage. It has also been extended to include AI accelerators, for example, because of their application specific nature. We also see this applied to renewable energy and electric transport propulsion circuits over the past five years.
The technical trend and direction have been the same for the past 70 years: better, smaller and faster.
Analog semiconductors are also important part of the semiconductor ecosystem and include signal processors which measure real-world signals such as temperature, sound and light as well as power semiconductors used for power management and efficiency in industrial and professional electronics. To further the historic trends and direction in semiconductors, the current movement in packaging is to a system on chip (SOC), which combines the best functions of other chips onto one ultra-small chipset.
SAM at $855 Billion for 2025
The SAM (serviceable available market) for active and passive components and related equipment and materials is estimated to be worth $855 billion for 2025, including $633 billion in active component sales and $72 billion in passive component and “other” materials sales and $125 billion in capital equipment sales (see Table 2.0).
Table 2.0
The Electronic Component, Equipment and Materials Ecosystem – 2025 Paumanok Perspective
Source: Paumanok Publications, Inc.
The focus of export restrictions in January 2025 includes the capital equipment with emphasis upon lithography equipment and the GPU in an attempt to place a lid on selected countries’ compute power - to a limit of 790 million TPP through 2027, which is equivalent to 50,000 advanced AI chips.
The Passive Component and Material Support Ecosystem
Passive electronic components provide support for all semiconductors and provide capacitance, resistance and inductance as needed for the active circuitry to effectively operate. Capacitance and resistance are fundamental and ubiquitous, while inductance (nanohenries) is more application specific in nature and design.
Capacitance is provided for by capacitors, and the circuit applications are related to bypass, decoupling, filtering and commutation. But in application-specific circumstances, the capacitor may be the primary component in the black box operation – related specifically to pulse discharge circuitry for medical and defense applications. Resistance includes the application of ohmic values to the circuitry in the form of linear resistance, or sensing, switching and circuit protection for non-linear resistors. Inductance is a magnetic function and provides nano-henries to the circuit for either noise abatement, signal and power or fine-tuning applications in application specific circuitry.
Passive components have the lowest level of profitability of almost all the support materials, and we estimate them to be 30% industry wide for 2025.
Other Materials
Other supply chains feeding into the active component market include sputtering targets, printed circuit boards, wire and cable, connectors, gasketing, solder, lead-frames and plastics packaging and molding materials.
All these materials work together to form a complex ecosystem that must work in concert together for a successful outcome.
Value And Volume Equations: Bill Of Materials
The BOM Value Equation
For 2025, we estimate that 90% of the global bill of materials for electronic devices ($633 billion) will be spent on active components (semiconductors) and 10% of a standard BOM will be spent on passive component support components and related raw materials.
The BOM Volume Equation
Meanwhile, with respect to the volume of consumption, the exact opposite is true, with the number of units consumed at 87% in favor of passive components (mostly MLCCs, thick film chip resistors and ferrite beads).
Figure 3.0
Value and Volume of Consumption of Active and Passive Components: Average Bill of Materials for 2025

Source: Paumanok IMR
Active and Passive Components: Equipment and Materials Intensive
The reader should note that active components are capital equipment dependent, and the price of the components reflect that variable cost structure. Meanwhile, high-volume passive components are raw material intensive and dependent upon a different set of variables anchored in metal and ceramic ores, powders and pastes.
Trends Driving Component And Materials Value And Innovation
As noted in this article, the driving force behind the components industry over the past 70 years has been the concept of better, smaller and faster. The key products that have been developed from this trend include portable computers, wireless handsets and artificial intelligence.
Volumetric Efficiency
When viewed based upon volumes of consumption, we note that any given printed circuit board will have approximately 87% passive components and 13% active components. Therefore, volumetric efficiency is largely influenced by passive components with emphasis upon the MLCCs, the thick film chip resistors and the ferrite beads.
These three product lines have made the greatest strides over the past 70 years to create electronic components on an increasingly smaller physical footprint while still providing meaningful capacitance, resistance and inductance at voltage. Meanwhile, the semiconductor industry is also achieving volumetric efficiency by developing SOC technology and combining memory, logic and other functions on one chip and also experimenting with advanced passive component solutions such as silicon capacitors produced with ion implantation machines.
A Suite of Support Components
In addition to the workhorses that are MLCCs, thick film chips and ferrite beads, there are also electrolytic capacitors, including aluminum and tantalum, and the other electrostatic part, the plastic film capacitor, as well as the nichrome film resistor, the wirewound resistor, the tin oxide resistor, the tantalum nitride resistor as well as the chip coil and ferrite core part. Each one of these passive component categories illustrates the vast suite of parts and materials in any given circuit board.
Other Advanced Materials
Other materials consumed for the substrate and connections are largely related to value-added plastics, ceramics and metals. Printed circuit boards are manufactured from FR4 plastics and wire, and connectors are manufactured from plastic insulation and jacketing materials and copper wires (ribbon cable and power cable) and tons of solder applied in waves. These are augmented with advanced substrates made from ceramic and metals for application specific circuitry involving high voltage, high frequency and high temperature.
Third Party Modularization-Power Supplies, Filters, Antennas and Application-Specific Modules
Passive electronic components can be combined to form fundamental board sub-assemblies such as power supplies, filters, antennas and application specific modules such as power amplifiers. The pursuit of better, smaller and faster has resulted in third party ecosystems of individual brands who excel at doing one thing well in a vast economic juggernaut known as the global high- tech economy.
The current movement to an SOC solution is the current high-water mark for computing. We note movement from both traditional manufacturers of memory and for ASICs pursuing new methods of achieving better, smaller and faster but clearly, as is shown in figure 3.0 above, the solution for that must come from passive component-size reduction.
From the passive component side, the solution has always been to produce smaller units through the manipulation of advanced ceramic and metal powders and pastes and the ability to stack up multiple layers of ceramics while producing trillions of pieces industry wide.
The future direction of volumetric efficiency for active and passive components will be one that combines semiconductor solutions for both active and passive functions in a single system on chip.
It is also important to note that no single part of the ecosystem exists without the other. Each set of sub-assemblies must come together at the end of their production cycle to create a black box that offers the consumer both provenance and utility of design. Large-end boxes include automobiles, computers, TV sets and home theatre electronics. Small-end boxes include power supplies, filters, engine control units; DC link circuits, thermostats; automation and drives, motor controllers, logging tools, civil aircraft, satellite electronics and relays.
Costs To Produce: Fixed And Variable Costs
Semiconductors: Costs To Produce
There is a fundamental difference between active and passive components when it comes to costs to produce. Semiconductors are capital equipment intensive, while passive components are raw material intensive. Variable costs associated with machine availability have significant impact on the ability for this ecosystem to produce. Rising exports over the past five years of photolithography and masking equipment out of Scandinavia and Japan are evidence of this trend.
On the plus side, the semiconductor manufacturing equipment itself is designed in such a way as to be volumetrically efficient so that large footprint factories are not necessary. In fact, there is so much wafer fabrication capacity dedicated to each tier of product output that there is ample opportunity for private labelling and fabless model production.
Raw materials for semiconductors are a secondary variable cost that take on a very unique ecosystem involving “targets and stencils and masks” as well as the unique market for high purity industrial water for cleaning the aforementioned. There is also the market for high-purity silicon glass wafers, which is also a narrow ecosystem, and even though based upon an abundant resource (silicon), becomes more specialized the higher up the technical scale of polishing one ascends.
These are all key feedstocks for the production of semiconductors and still these parts are reliant upon passive electronic components to function.
All semiconductors have low volumes when compared to their passive support components and high average unit prices and is the largest cost factor when it comes to costs of any high-tech, electronic end-product’s bill of materials. Passive electronic components and all other non-electronic component materials comprise only 10% of the value of a BOM, while active components account for 90%.
Passive Electronic Components: Costs to Produce
For passive electronic components – which we have noted as having 30% gross profit margins on average and 70% cost of goods sold, we note that to improve profitability, vendors focus primarily on variable costs, including raw materials, labor, variable overhead and variable manufacturing costs.
Raw materials costs represent the largest single cost factor in the production of capacitors regardless of dielectric, so the reader will notice that many historical methods for cost savings and increased profitability are related to management and manipulation of the costs associated with buying and processing raw materials, including feedstocks, engineered dielectrics, cathode materials, additives, electrodes, terminations and leads.
Summary And Conclusions
We value the global component and support equipment and materials industries at $855 billion for 2025, with semiconductors accounting for $633 billion, semiconductor manufacturing equipment at $125 billion (an extension of R&D) and all related support passive components and electronic materials at $72 billion for 2025.
Active components gross profit margins are expected to be 45% on average for 2025, while passive components will have gross profit margins of 30% on average. Semiconductor manufacturing equipment is a unique industry outgrowth valued at $125 billion and should be viewed as an extension of R&D.
The trend and direction in electronic component manufacturing has been better, smaller and faster for the past 70 years and we expect this trend to continue through a greater merger of high-volume, low-cost passives with high-value, low-volume SOC semiconductor components.
Paumanok Publications, Inc. is the world's largest supplier of market research and consulting services to the passive electronic component industry. For 36 years, Paumanok has supplied research products and services for trade companies and private equity firms that have a financial interest in or are directly involved in the supply chain for capacitors, resistors, inductors and circuit protection components as well as the engineered materials and ores associated with their key functions.
Follow TTI, Inc. on LinkedIn for more news and market insights.
Statements of fact and opinions expressed in posts by contributors are the responsibility of the authors alone and do not imply an opinion of the officers or the representatives of TTI, Inc. or the TTI Family of Specialists.
Dennis M. Zogbi

Dennis M. Zogbi is the author of more than 260 market research reports on the worldwide electronic components industry. Specializing in capacitors, resistors, inductors and circuit protection component markets, technologies and opportunities; electronic materials including tantalum, ceramics, aluminum, plastics; palladium, ruthenium, nickel, copper, barium, titanium, activated carbon, and conductive polymers. Zogbi produces off-the-shelf market research reports through his wholly owned company, Paumanok Publications, Inc, as well as single client consulting, on-site presentations, due diligence for mergers and acquisitions, and he is the majority owner of Passive Component Industry Magazine LLC.